GridLog
Spreadsheets aren’t just for crying over spilled checking accounts. They can be great tools for logging or any time you need to present sorted information with flexible user access and manipulation. Take a look at Excel in a new light. See if you don’t agree it’s a powerful tool for presenting logs.
It’s also kind of cool to produce an Excel spreadsheet on a Linux host without any time spent in Windows fiddling with layout. In fact, it’s so cool it often flies right off the radar. Your colleagues might assume you spent hours cutting and pasting logs into Excel.
That might be a good thing if you’re the one producing comprehensive, readable reports in advance of deadlines. No harm in being quick with good data.
That’s why I created GridLog. It offers an easy way to create nice presentations of categorized data. Excel files are easy to manipulate on anything running Python with the openpyxl library, GridLog’s sole dependency. You don’t need Excel itself.
Let’s say there arises high curiosity into something regarding systemd, which is logged in the main system log, cron jobs, and messages logged in /var/log/secure. We need to depict data from three sources in one nice package.
Cool. Let’s define an Excel file with three tabs. Each tab will have three columns. Timestamps, PID, and log message will appear with a row of descriptive column headers. We do that with a quick and simple YAML specification:
cfg = """
---
test.xlsx:
    tabs:
        Systemd:
            logfile: systemd # log file for this tab
            description: >
                Systemd messages from /var/log/messages
            rowheaders: 0
            colheaders: 1
            cols:
                A:
                    title: Timestamp
                B:
                    title: PID
                C:
                    title: Systemd message
        Secure:
            logfile: securelog
            description: >
                Log entries found in /var/log/secure
            rowheaders: 0
            colheaders: 1
            cols:
                A:
                    title: Timestamp
                B:
                    title: PID
                C:
                    title: Secure log message
        Cron:
            logfile: cronlog
            description: >
                Cron logging, taken from /var/log/cron
            rowheaders: 0
            colheaders: 1
            cols:
                A:
                    title: Timestamp
                B:
                    title: PID
                C:
                    title: Cron log message
    """
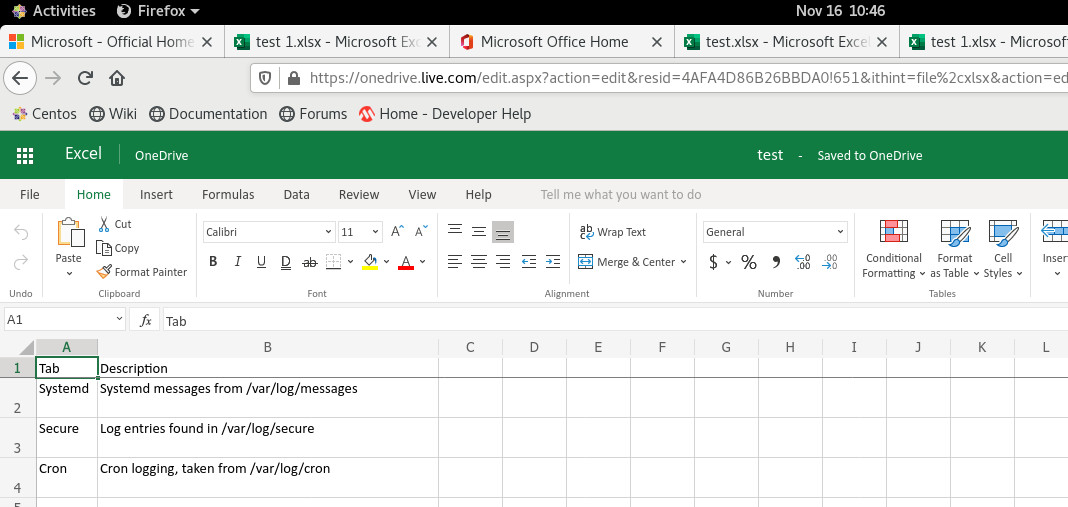
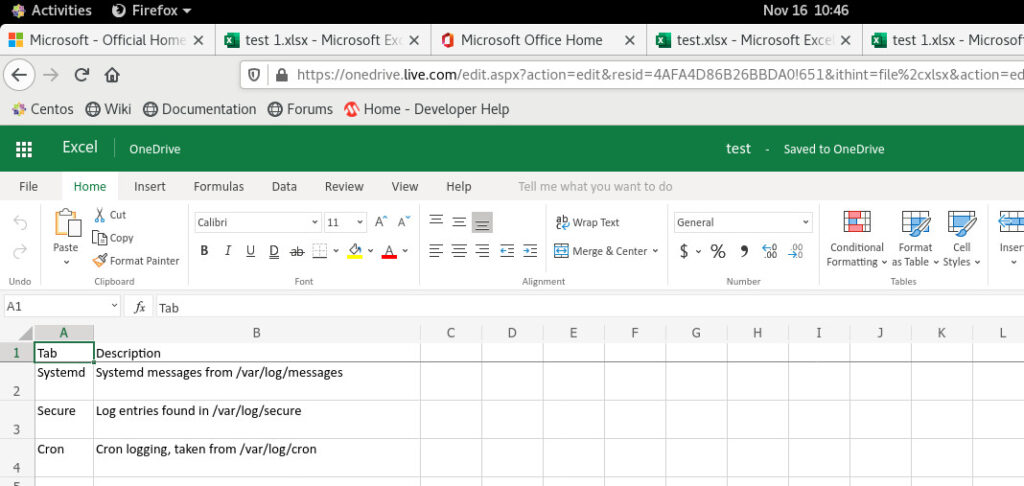
We’ll also get, for free, a Summary tab that will use the “description” fields from the above YAML The Summary tab acts as a table of contents and provides context for the data. That’s why the description fields say things like “Cron logging, taken from /var/log/cron.” A year from now, someone could look at this and know where the data came from. All three sources are always flying in close formation because they are housed in a single Excel file.
More information about the YAML fields is included in the PDF documentation bundled with gridlog.py.
Using GridLog is about as simple as it gets. One line of code to open the output spreadsheet and optional text log files and one line to close everything down.
Between the two, a single line writes a row to any tab in any workbook defined in the YAML.
Here’s a sample use of GridLog, based on the YAML specification shown above, and capturing the systemd, cron, and secure messages we’re interested in:
# compile a regular expression to grab the timestamp, pid, and message from logs
logLineRe = re.compile(r'^([a-z]{3}\s+\d+\s+\d+:\d+:\d+)\s+linux\s+([^\[]+)\[(\d+)\]:\s+(.*)$', re.I)
    # create a logger object from our YAML specification
    gLog = GridLog(cfg)
    # process log files, comparison strings, and tabs
    for logger in zip(
                      ('/var/log/messages',
                       '/var/log/secure',
                       '/var/log/cron'),
                      ('systemd', None, None),
                      ('Systemd', 'Secure', 'Cron')):
        # read each log file
        for l in open(logger[0], 'rt'):
            # check for regular expression match
            m = logLineRe.match(l)
            if m: # on match
                # if there is a string to match, check it
                if logger[1]:
                    if m.group(2) != logger[1]: continue
                # add a row to the correct tab
                gLog.addRow('test.xlsx', logger[2],
                   (m.group(1), m.group(3), m.group(4)))
    # save the spreadsheet and close the text log files
    gLog.close()
That’s it. Nothing more is required. If you aren’t a native regular expression speaker, that line starting with logLineRe will look cryptic, but it doesn’t do anything very fancy. It lets us alert on log lines that match a certain format, and it will hand us the time stamp, the logger’s name (like “systemd”), the process ID, and the contents of the log message.
There are ten lines of code in that example. They read every line in three log files, split the systemd entries from one of them, and sort the log lines into spreadsheet tabs.
Text files were also created for grepping or other use.
Here’s what our output looked like. First, there was our Summary tab:
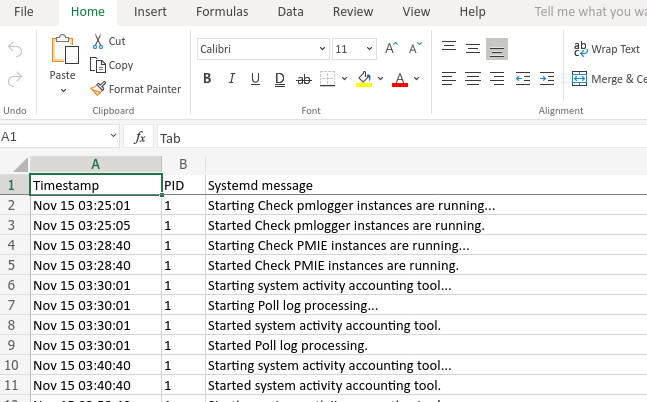
The next tab in the file was for systemd messages:
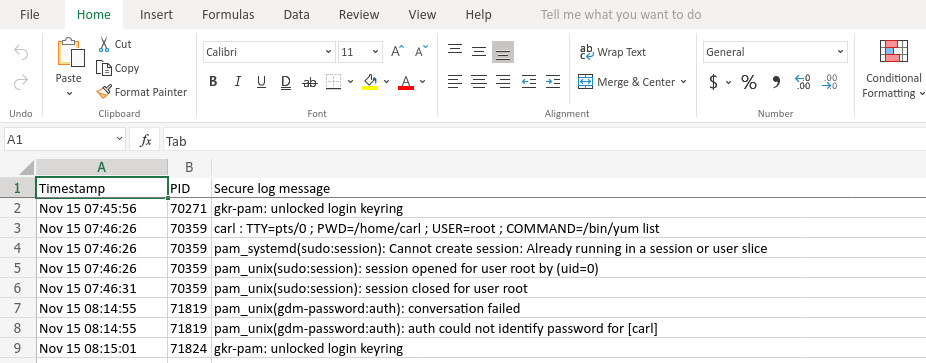
Next came our copy of /var/log/secure:
And, lastly, our cron log:
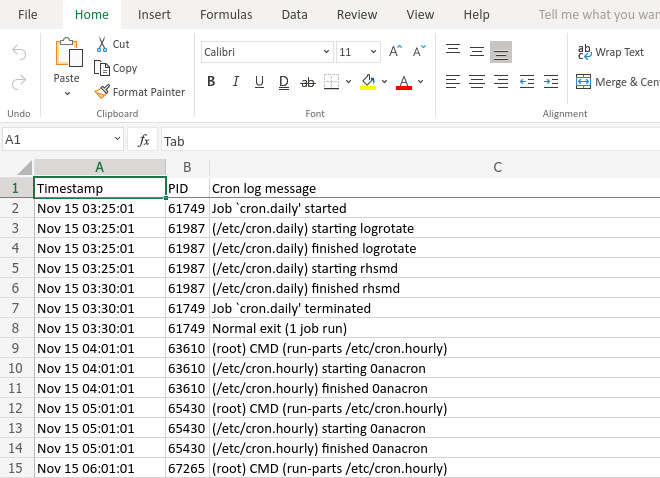
A word of explanation is in order. It’s really not very forward-thinking to share log files like this openly. These files were from a crash-and-burn lab machine. The hardware is my property, isn’t accessible from the Internet at large, and has already been knocked down and rebuilt, anyway.
GridLog is a fun sort of Python class. It takes a general purpose library, openpyxl, and applies it to a commonly needed task. In the future, for nearly zero effort, you get both text logging and presentation-quality communications.
If you’ve got X running on your Linux host and access to microsoft.com, you can use a free Office Online account to work with the spreadsheets produced by GridLog without downloading to a Windows box.
Spreadsheet output is an option any time you need to present categorized data. It’s easiest to think of GridLog as a logging tool, but there are other uses, too. In the example above, we weren’t really logging as much as we were reading information and pitching it in the right pile. GridLog took care of making the pile look pretty.
Need more info? Fire away in the comments below, by email to carl@carlhaddick.com, or via the Get in Touch! link at the top of this page. Source to gridlog.py and a nice detailed PDF document is available for download here.